
Postgresql 性能优化 之 select优化操作 提升速度
对于庞大的数据,检索sql的编写要格外小心,有很多平时不注意的sql可能就会变成瓶颈。
比如, 我们有个系统, 其中t96_pd_log表,记录数8000w多,在开发阶段乃至用了那么多年都没问题, 最近却发生频繁死锁的问题, 查数据库后台发现问题出在一个select语句上, 它耗时高达2.4-2.7s,这对于一个需要高并发的系统来说当然是致命的。
数据表t96_pd_log有两条index, 一条的字段组成是f96_mgtbarcd,另一条的字段组成是f96_result_type, 检索sql是这样写的:
select recseq,f96_create_dt,f96_op from t96_pd_log where f96_mgtbarcd=’113D1907032385′
and f96_station=’AS01-L113′ and f96_result_type=’TFT’
and f96_qty=1 order by f96_create_dt desc limit 1
意在找出AS01-L113站位最近一条有效的记录,而这条sql有足够的index支持,但耗时高达2.7s。
F7查一下,居然包含f96_result_type的这支索引也参与运算, 这就出事了, 因为f96_result_type有相同值的记录极其多,从图3也可以看出, 这也是主要耗费时间的环节。
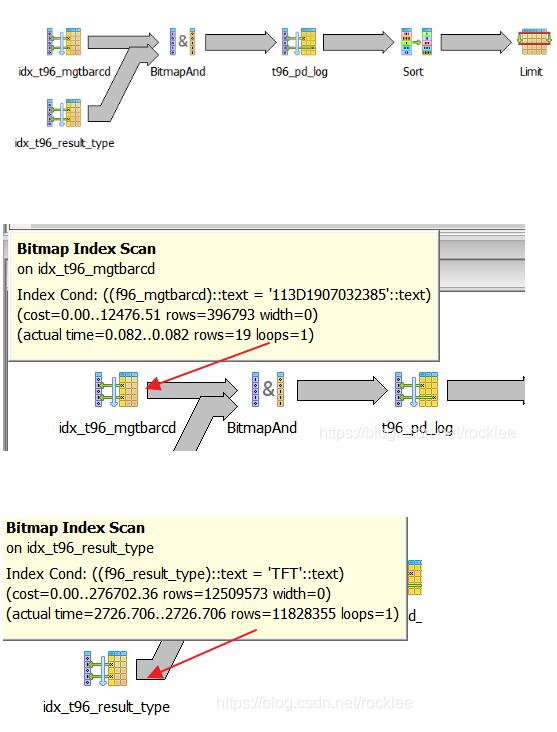
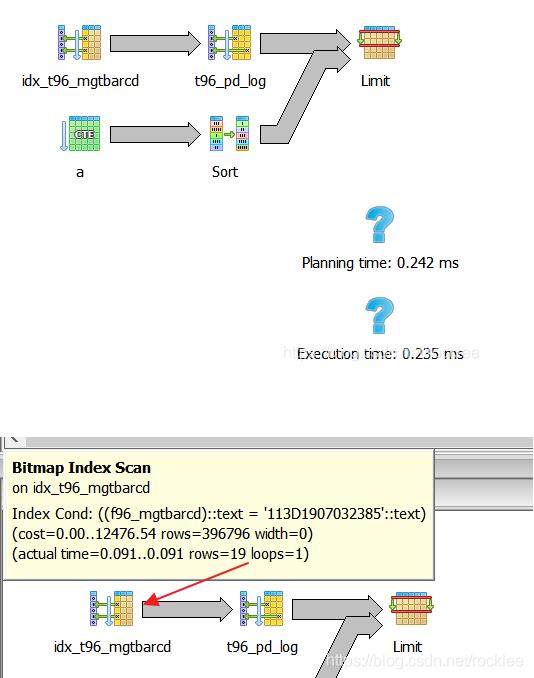
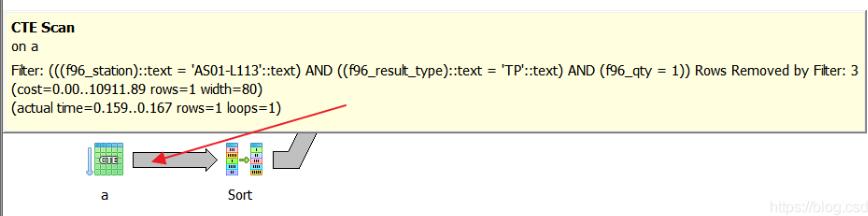
通过数据分析, f96_mgtbarcd值相同的记录数很少, 所以我们可以将顺序改一下,先用f96_mgtbarcd作为过滤器生成一个子集后, 再从这个子集里面做f96_result_type等过滤, 跑了一下,13ms, 足足快了这样就快200多倍,如下:
with a as (
select recseq,f96_create_dt,f96_op,f96_station,f96_result_type,f96_qty from t96_pd_log where f96_mgtbarcd=’113D1907032385′
)
select recseq,f96_create_dt,f96_op from a where f96_station=’AS01-L113′ and f96_result_type=’TP’ and f96_qty=1 order by f96_create_dt desc limit 1
ps:我用的工具是 pgAdmin自带的,F7, Shift-F7
补充:PostgreSql查询优化之根据执行计划优化SQL
1、执行计划路径选择
postgresql查询规划过程中,查询请求的不同执行方案是通过建立不同的路径来表达的,在生成许多符合条件的路径之后,要从中选择出代价最小的路径(基于成本运算),把它转化为一个计划,传递给执行器执行,规划器的核心工作就是生成多条路径,然后从中找出最优的那一条。
1.1代价评估
评估路径优劣的依据是用系统表pg_statistic中的统计信息估算出来的不同路径的代价(cost),PostgreSQL估计计划成本的方式:基于统计信息估计计划中各个节点的成本。PostgreSQL会分析各个表来获取一个统计信息样本(这个操作通常是由autovacuum这个守护进程周期性的执行analyze,来收集这些统计信息,然后保存到pg_statistic和pg_class里面)。
1.2用于估算代价的参数postgresql.conf
# – Planner Cost Constants –
#seq_page_cost = 1.0 # measured on an arbitrary scale 顺序磁盘扫描时单个页面的开销
#random_page_cost = 4.0 # same scale as above 随机磁盘访问时单页面的读取开销
#cpu_tuple_cost = 0.01 # same scale as above cpu处理每一行的开销
#cpu_index_tuple_cost = 0.005 # same scale as above cpu处理每个索引行的开销
#cpu_operator_cost = 0.0025 # same scale as above cpu处理每个运算符或者函数调用的开销
#parallel_tuple_cost = 0.1 # same scale as above 计算并行处理的成本,如果成本高于非并行,则不会开启并行处理。
#parallel_setup_cost = 1000.0 # same scale as above
#min_parallel_relation_size = 8MB
#effective_cache_size = 4GB 再一次索引扫描中可用的文件系统内核缓冲区有效大小
也可以使用 show all的方式查看
1.3 路径的选择
–查看表信息
highgo=# \d t_jcxxgl_tjaj
Table “db_jcxx.t_jcxxgl_tjaj”
Column | Type | Modifiers ————–+——————————–+———–
c_bh | character(32) | not null
c_xzdm | character varying(300) |
c_jgid | character(32) |
c_ajbm | character(22) |
…
Indexes:
“t_jcxxgl_tjaj_pkey” PRIMARY KEY, btree (c_bh)
“idx_ttjaj_cah” btree (c_ah)
“idx_ttjaj_dslrq” btree (d_slrq)
首先更新统计信息vacuum analyze t_jcxxgl_tjaj,许多时候可能因为统计信息的不准确导致了不正常的执行计划–执行计划。
–执行计划,全表扫描
highgo=# explain (analyze,verbose,costs,buffers,timing)select c_bh,c_xzdm,c_jgid,c_ajbm from t_jcxxgl_tjaj where d_slrq >=’2018-03-18′;
QUERY PLAN ————————————————————————————————————
Seq Scan on db_jcxx.t_jcxxgl_tjaj (cost=0.00..9.76 rows=3 width=96) (actual time=1.031..1.055 rows=3 loops
=1)
Output: c_bh, c_xzdm, c_jgid, c_ajbm
Filter: (t_jcxxgl_tjaj.d_slrq >= ‘2018-03-18’::date)
Rows Removed by Filter: 138
Buffers: shared hit=8
Planning time: 6.579 ms
Execution time: 1.163 ms
(7 rows)
如上,d_slrq是有索引的,但是执行计划中并没有走索引,为什么呢?我们继续往下看。
–执行计划,关闭全表扫描
highgo=# set session enable_seqscan = off;
SET
highgo=# explain (analyze,verbose,costs,buffers,timing)select c_bh,c_xzdm,c_jgid,c_ajbm from t_jcxxgl_tjaj where d_slrq >=’2018-03-18′;
QUERY PLAN ————————————————————————————————————
Index Scan using idx_ttjaj_dslrq on db_jcxx.t_jcxxgl_tjaj (cost=0.14..13.90 rows=3 width=96) (actual time=0.012..0.026 rows=3 loops=1)
Output: c_bh, c_xzdm, c_jgid, c_ajbm
Index Cond: (t_jcxxgl_tjaj.d_slrq >= ‘2018-03-18’::date)
Buffers: shared hit=4
Planning time: 0.309 ms
Execution time: 0.063 ms
(6 rows)
d_slrq上面有btree索引,但是查看执行计划并没有走索引,这是为什么呢?
代价计算:
一个路径的估算由三部分组成:启动代价(startup cost),总代价(totalcost),执行结果的排序方式(pathkeys)
代价估算公式:
总代价=启动代价+I/O代价+CPU代价(cost=S+P+W*T)
P:执行时要访问的页面数,反应磁盘的I/O次数
T:表示在执行时所要访问的元组数,反映了cpu开销
W:表示磁盘I/O代价和CPU开销建的权重因子
统计信息:
统计信息的其中一部分是每个表和索引中项的总数,以及每个表和索引占用的磁盘块数。这些信息保存在pg_class表的reltuples和relpages列中。我们可以这样查询相关信息:
–查看统计信息
highgo=# select relpages,reltuples from pg_class where relname =’t_jcxxgl_tjaj’;
relpages | reltuples ———-+———–
8 | 141
(1 row)
total_cost = 1(seq_page_cost)*8(磁盘总页数)+0.01(cpu_tuple_cost)*141(表的总记录数)+0.0025(cpu_operation_cost)*141(表的总记录数)=9.7625
可以看到走索引的cost=13.90比全表扫描cost=9.76要大。所以上面没有关闭全表扫描的时候,根据成本代价,执行计划走的全表扫描。在表较小的情况下,全表扫描比索引扫描更有效, index scan 至少要发生两次I/O,一次是读取索引块,一次是读取数据块。
2、一个SQL优化实例
2.1慢SQL:
select c_ajbh, c_ah, c_cbfy, c_cbrxm, d_larq, d_jarq, n_dbjg, c_yqly from db_zxzhld.t_zhld_db dbxx join db_zxzhld.t_zhld_ajdbxx dbaj on dbxx.c_bh = dbaj.c_dbbh where dbxx.n_valid=1 and dbxx.n_state in (1,2,3) and dbxx.c_dbztbh=’1003′ and dbaj.c_zblx=’1003′ and dbaj.c_dbfy=’0′ and dbaj.c_gy = ‘2550’ and c_ajbh in (select distinct c_ajbh from db_zxzhld.t_zhld_zbajxx where n_dbzt = 1 and c_zblx = ‘1003’ and c_gy = ‘2550’ ) order by d_larq asc, c_ajbh asc limit 15 offset 0;
慢sql耗时:7s
先过下这个sql是干什么的、首先dbxx和dbaj的一个join连接然后dbaj.c_ajbh要包含在zbaj表里面,做了个排序,取了15条记录、大概就这样。
Sql有个缺点就是我不知道查询的字段是从那个表里面取的、建议加上表别名.字段。
查看该sql的表的数据量:
t_zhld_db :1311
t_zhld_ajdbxx :341296
t_zhld_zbajxx :1027619
执行计划:
01 Limit (cost=36328.67..36328.68 rows=1 width=107) (actual time=88957.677..88957.729 rows=15 loops=1)
02 -> Sort (cost=36328.67..36328.68 rows=1 width=107) (actual time=88957.653..88957.672 rows=15 loops=1)
03 Sort Key: dbaj.d_larq, dbaj.c_ajbh
04 Sort Method: top-N heapsort Memory: 27kB
05 -> Nested Loop Semi Join (cost=17099.76..36328.66 rows=1 width=107) (actual time=277.794..88932.662 rows=8605 loops=1)
06 Join Filter: ((dbaj.c_ajbh)::text = (t_zhld_zbajxx.c_ajbh)::text)
07 Rows Removed by Join Filter: 37018710
08 -> Nested Loop (cost=0.00..19200.59 rows=1 width=107) (actual time=199.141..601.845 rows=8605 loops=1)
09 Join Filter: (dbxx.c_bh = dbaj.c_dbbh)
10 Rows Removed by Join Filter: 111865
11 -> Seq Scan on t_zhld_ajdbxx dbaj (cost=0.00..19117.70 rows=219 width=140) (actual time=198.871..266.182 rows=8605 loops=1)
12 Filter: ((n_valid = 1) AND ((c_zblx)::text = ‘1003’::text) AND ((c_dbfy)::text = ‘0’::text) AND ((c_gy)::text = ‘2550’::text))
13 Rows Removed by Filter: 332691
14 -> Materialize (cost=0.00..66.48 rows=5 width=33) (actual time=0.001..0.017 rows=14 loops=8605)
15 -> Seq Scan on t_zhld_db dbxx (cost=0.00..66.45 rows=5 width=33) (actual time=0.044..0.722 rows=14 loops=1)
16 Filter: ((n_valid = 1) AND ((c_dbztbh)::text = ‘1003’::text) AND (n_state = ANY (‘{1,2,3}’::integer[])))
17 Rows Removed by Filter: 1297
18 -> Materialize (cost=17099.76..17117.46 rows=708 width=32) (actual time=0.006..4.890 rows=4303 loops=8605)
19 -> HashAggregate (cost=17099.76..17106.84 rows=708 width=32) (actual time=44.011..54.924 rows=8605 loops=1)
20 Group Key: t_zhld_zbajxx.c_ajbh
21 -> Bitmap Heap Scan on t_zhld_zbajxx (cost=163.36..17097.99 rows=708 width=32) (actual time=5.218..30.278 rows=8605 loops=1)
22 Recheck Cond: ((n_dbzt = 1) AND ((c_zblx)::text = ‘1003’::text))
23 Filter: ((c_gy)::text = ‘2550’::text)
24 Rows Removed by Filter: 21849
25 Heap Blocks: exact=960
26 -> Bitmap Index Scan on i_tzhldzbajxx_zblx_dbzt (cost=0.00..163.19 rows=5876 width=0) (actual time=5.011..5.011 rows=30458 loops=1)
27 Index Cond: ((n_dbzt = 1) AND ((c_zblx)::text = ‘1003’::text))
28 Planning time: 1.258 ms
29 Execution time: 88958.029 ms
执行计划解读:
1:第27->21行,通过索引i_tzhldzbajxx_zblx_dbzt过滤表t_zhld_zbajxx的数据,然后根据过滤条件(c_gy)::text = ‘2550’::text过滤最终返回8605条数据
2:第17->15行,根据条件过滤t_zhld_db表的数据,最终返回了14条数据
3:第20->19行,对表t_zhld_zbajxx做group by的操作
4:第13->11行,全表扫描t_zhld_ajdbxx 最终返回了8605条数据
5:第08行,根据t_zhld_ajdbxx返回的8605条结果集作为驱动表和t_zhld_db的结果集(14条)做嵌套循环,t_zhld_db的结果集被循环了8605次。然后过滤掉了其中的111865条记录,那么最终将得到(8605*14-111865) = 8605
6:第07->05行,根据第08和18行返回的结果集最终做了Nested Loop Semi Join,第18行的4303条结果集被循环了8605次,(4303*8605-37018710)=8605
7: 第04->02行,对最终的8605条记录进行排序
8:第01行,limit最终获取15条记录
整个执行计划中耗时最长的地方在05行Nested Loop Semi Join,actual time=277.794..88932.662, 表db_zxzhld.t_zhld_db dbxx和db_zxzhld.t_zhld_ajdbxx均是全表扫描
2.2具体优化步骤
查看索引页并没有索引,创建c_ajbh,c_dbbh等逻辑外键的索引
drop index if exists I_T_ZHLD_AJDBXX_AJBH;
create index I_T_ZHLD_AJDBXX_AJBH on T_ZHLD_AJDBXX (c_ajbh);
commit;
drop index if exists I_T_ZHLD_AJDBXX_DBBH;
create index I_T_ZHLD_AJDBXX_DBBH on T_ZHLD_AJDBXX (c_dbbh);
commit;
创建d_larq,c_ajbh的排序索引:
drop index if exists I_T_ZHLD_AJDBXX_m6;create index I_T_ZHLD_AJDBXX_m6 on T_ZHLD_AJDBXX (c_zblx,c_dbfy,c_gy,d_larq asc,c_ajbh asc);
commit;
drop index if exists I_T_ZHLD_ZBAJXX_h3 ;
create index I_T_ZHLD_ZBAJXX_h3 on db_zxzhld.t_zhld_zbajxx (n_dbzt,c_zblx,c_gy,c_gy);
commit;
创建索引后执行计划有了改变,原来的dbaj表和dbxx表先做nestedloop变成了zbaj和dbaj表先做了nestedloop join,总的cost也从36328.68降到了12802.87,
执行计划
Limit (cost=12802.87..12802.87 rows=1 width=107) (actual time=4263.598..4263.648 rows=15 loops=1)
-> Sort (cost=12802.87..12802.87 rows=1 width=107) (actual time=4263.592..4263.609 rows=15 loops=1)
Sort Key: dbaj.d_larq, dbaj.c_ajbh
Sort Method: top-N heapsort Memory: 27kB
-> Nested Loop (cost=2516.05..12802.86 rows=1 width=107) (actual time=74.240..4239.723 rows=8605 loops=1)
Join Filter: (dbaj.c_dbbh = dbxx.c_bh)
Rows Removed by Join Filter: 111865
-> Nested Loop (cost=2516.05..12736.34 rows=1 width=140) (actual time=74.083..327.974 rows=8605 loops=1)
-> HashAggregate (cost=2515.62..2522.76 rows=714 width=32) (actual time=74.025..90.185 rows=8605 loops=1)
Group Key: (“ANY_subquery”.c_ajbh)::text
-> Subquery Scan on “ANY_subquery” (cost=2499.56..2513.84 rows=714 width=32) (actual time=28.782..59.823 rows=8605 loops=1)
-> HashAggregate (cost=2499.56..2506.70 rows=714 width=32) (actual time=28.778..39.968 rows=8605 loops=1)
Group Key: zbaj.c_ajbh
-> Index Scan using i_t_zhld_zbajxx_h3 on t_zhld_zbajxx zbaj (cost=0.42..2497.77 rows=715 width=32) (actual time=0.062..15.104 rows=8605 loops=1)
Index Cond: ((n_dbzt = 1) AND ((c_zblx)::text = ‘1003’::text) AND ((c_gy)::text = ‘2550’::text))
-> Index Scan using i_t_zhld_ajdbxx_ajbh on t_zhld_ajdbxx dbaj (cost=0.42..14.29 rows=1 width=140) (actual time=0.015..0.021 rows=1 loops=8605)
Index Cond: ((c_ajbh)::text = (“ANY_subquery”.c_ajbh)::text)
Filter: (((c_zblx)::text = ‘1003’::text) AND ((c_dbfy)::text = ‘0’::text) AND ((c_gy)::text = ‘2550’::text))
Rows Removed by Filter: 1
-> Seq Scan on t_zhld_db dbxx (cost=0.00..66.45 rows=5 width=33) (actual time=0.015..0.430 rows=14 loops=8605)
Filter: ((n_valid = 1) AND ((c_dbztbh)::text = ‘1003’::text) AND (n_state = ANY (‘{1,2,3}’::integer[])))
Rows Removed by Filter: 1298
Planning time: 1.075 ms
Execution time: 4263.803 ms
执行的时间还是要4s左右仍然不满足需求,并且没有使用上I_T_ZHLD_AJDBXX_m6这个索引。
2.3等价改写SQL(1)
等价改写:将排序条件加入db_zxzhld.t_zhld_ajdbxx让其先排序,再和t_zhld_db表连接。
修改后sql:
Select dbaj.c_ajbh, dbaj.c_ah, dbaj.c_cbfy, dbaj.c_cbrxm, dbaj.d_larq, dbaj.d_jarq, dbaj.n_dbjg, dbaj.c_yqly from (select * from db_zxzhld.t_zhld_db where n_valid=1 and n_state in (1,2,3) and c_dbztbh=’1003′ )dbxx
join (select * from db_zxzhld.t_zhld_ajdbxx where n_valid=1 and c_zblx=’1003′
and c_dbfy=’0′ and c_gy = ‘2550’ and
c_ajbh in (select distinct c_ajbh from db_zxzhld.t_zhld_zbajxx where n_dbzt = 1 and c_zblx = ‘1003’ and c_gy = ‘2550’ ) order by d_larq asc, c_ajbh asc)dbajon dbxx.c_bh = dbaj.c_dbbh
limit 15 offset 0
再次查看执行计划:
Limit (cost=3223.92..3231.97 rows=1 width=107) (actual time=127.291..127.536 rows=15 loops=1)
-> Nested Loop (cost=3223.92..3231.97 rows=1 width=107) (actual time=127.285..127.496 rows=15 loops=1)
-> Sort (cost=3223.64..3223.65 rows=1 width=140) (actual time=127.210..127.225 rows=15 loops=1)
Sort Key: t_zhld_ajdbxx.d_larq, t_zhld_ajdbxx.c_ajbh
Sort Method: quicksort Memory: 2618kB
-> Hash Semi Join (cost=2523.19..3223.63 rows=1 width=140) (actual time=55.913..107.265 rows=8605 loops=1)
Hash Cond: ((t_zhld_ajdbxx.c_ajbh)::text = (t_zhld_zbajxx.c_ajbh)::text)
-> Index Scan using i_t_zhld_ajdbxx_m6 on t_zhld_ajdbxx (cost=0.42..700.28 rows=219 width=140) (actual time=0.065..22.005 rows=8605 loops=1)
Index Cond: (((c_zblx)::text = ‘1003’::text) AND ((c_dbfy)::text = ‘0’::text) AND ((c_gy)::text = ‘2550’::text))
-> Hash (cost=2513.84..2513.84 rows=714 width=32) (actual time=55.802..55.802 rows=8605 loops=1)
Buckets: 16384 (originally 1024) Batches: 1 (originally 1) Memory Usage: 675kB
-> HashAggregate (cost=2499.56..2506.70 rows=714 width=32) (actual time=30.530..43.275 rows=8605 loops=1)
Group Key: t_zhld_zbajxx.c_ajbh
-> Index Scan using i_t_zhld_zbajxx_h3 on t_zhld_zbajxx (cost=0.42..2497.77 rows=715 width=32) (actual time=0.043..15.552 rows=8605 loops=1)
Index Cond: ((n_dbzt = 1) AND ((c_zblx)::text = ‘1003’::text) AND ((c_gy)::text = ‘2550’::text))
-> Index Scan using t_zhld_db_pkey on t_zhld_db (cost=0.28..8.30 rows=1 width=33) (actual time=0.009..0.011 rows=1 loops=15)
Index Cond: (c_bh = t_zhld_ajdbxx.c_dbbh)
Filter: (((c_dbztbh)::text = ‘1003’::text) AND (n_state = ANY (‘{1,2,3}’::integer[])))
Planning time: 1.154 ms
Execution time: 127.734 ms
这一次可以看出,ajdbxx和zbajxx表做了hash semi join 消除了nestedloop,cost降到了3231.97。并且使用上了i_t_zhld_ajdbxx_m6子查询中in的结果集有一万多条数据。
继续尝试使用exists等价改写in,看能否有更好的结果
2.4等价改写SQL(2)
等价改写:将in替换为exists:
select c_ajbh, c_ah, c_cbfy, c_cbrxm, d_larq, d_jarq, n_dbjg, c_yqlyfrom (select c_bh from db_zxzhld.t_zhld_db where n_state in (1,2,3) and c_dbztbh=’1003′ )dbxx
join (select c_ajbh, c_ah, c_cbfy, c_cbrxm, d_larq, d_jarq, n_dbjg, c_yqly,c_dbbh from db_zxzhld.t_zhld_ajdbxx ajdbxxwhere c_zblx=’1003′
and c_dbfy=’0′ and c_gy = ‘2550’ and
exists (select distinct c_ajbh from db_zxzhld.t_zhld_zbajxx zbajxx where ajdbxx.c_ajbh = zbajxx.c_ajbh and n_dbzt = 1 and c_zblx = ‘1003’ and c_gy = ‘2550’ ) order by d_larq asc, c_ajbh asc)dbajon dbxx.c_bh = dbaj.c_dbbh
limit 15 offset 0
再次查看执行计划:
Limit (cost=1.12..2547.17 rows=1 width=107) (actual time=0.140..0.727 rows=15 loops=1)
-> Nested Loop (cost=1.12..2547.17 rows=1 width=107) (actual time=0.136..0.689 rows=15 loops=1)
-> Nested Loop Semi Join (cost=0.85..2538.84 rows=1 width=140) (actual time=0.115..0.493 rows=15 loops=1)
-> Index Scan using i_t_zhld_ajdbxx_m6 on t_zhld_ajdbxx t2 (cost=0.42..700.28 rows=219 width=140) (actual time=0.076..0.127 rows=15 loops=1)
Index Cond: (((c_zblx)::text = ‘1003’::text) AND ((c_dbfy)::text = ‘0’::text) AND ((c_gy)::text = ‘2550’::text))
-> Index Scan using i_t_zhld_zbajxx_c_ajbh on t_zhld_zbajxx t3 (cost=0.42..8.40 rows=1 width=32) (actual time=0.019..0.019 rows=1 loops=15)
Index Cond: ((c_ajbh)::text = (t2.c_ajbh)::text)
Filter: (((c_zblx)::text = ‘1003’::text) AND ((c_gy)::text = ‘2550’::text) AND (n_dbzt = 1))
-> Index Scan using t_zhld_db_pkey on t_zhld_db (cost=0.28..8.30 rows=1 width=33) (actual time=0.007..0.008 rows=1 loops=15)
Index Cond: (c_bh = t2.c_dbbh)
Filter: (((c_dbztbh)::text = ‘1003’::text) AND (n_state = ANY (‘{1,2,3}’::integer[])))
Planning time: 1.268 ms
Execution time: 0.859 ms
可以看出使用exist效果更好,最终cost 2547.17
(1).少了t_zhld_zbajxx表的group by操作:Sort Key: t_zhld_ajdbxx.d_larq, t_zhld_ajdbxx.c_ajbh。(这一步是因为使用了索引中的排序)
(2).少了分组的操作:Group Key: t_zhld_zbajxx.c_ajbh。
第(2)为什么这个查询消除了t_zhld_zbajxx表的group by操作呢?
原因是exists替换了distinct的功能,一旦满足条件则立刻返回。所以使用exists的时候子查询可以直接去掉distinct。
以上为个人经验,希望能给大家一个参考,也希望大家多多支持。如有错误或未考虑完全的地方,望不吝赐教。
